Overview
Jump to navigation
Jump to search
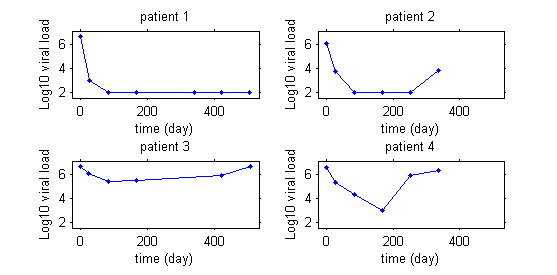
This first graphics display the viral load of four patients with hepatitis C who start a treatment at time $t=0$.
|
|
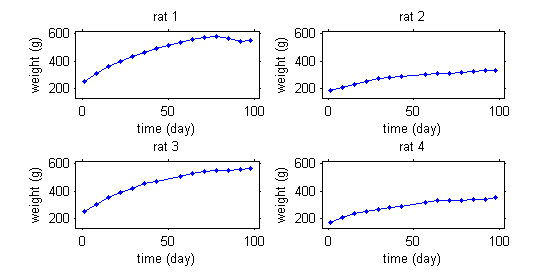
This second example involves weight data of rats, measured over 14 weeks in a setting of a sub-chronic toxicity study linked to Genetically Modified corn.
|
|
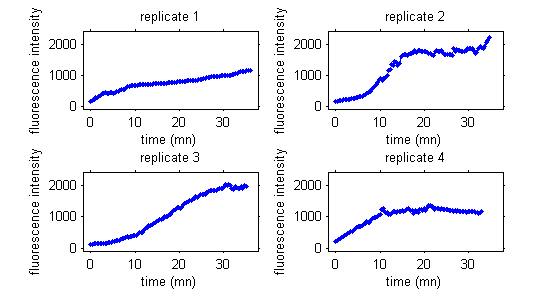
Here, the data are fluorescence intensities measured over time during a cellular biology experiment.
|
|
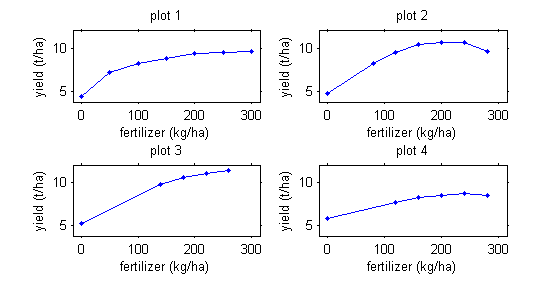
Repeated measurements are not necessarily functions of time. For example, we may be interested in corn production as a function of fertilizer quantity.
|
|

 |